Exercise
Start by using the existing widget template “Exercise: Minimalistic KPI” in the widget library “widget-exercises”.
- Create a new header in the property panel called “Settings”
- Create the following custom properties using the Property Panel editor
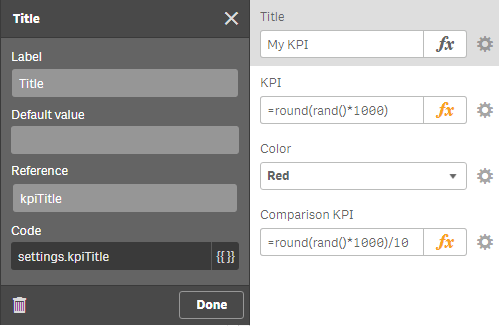
- Title (Input, name “Title”, reference
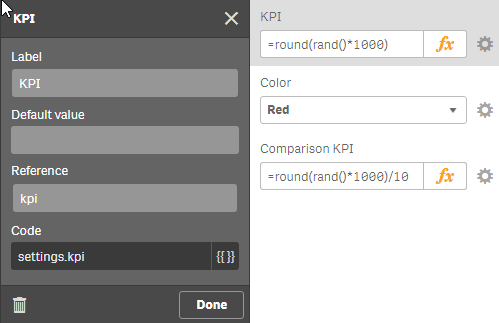
kpiTitle) - KPI (Input, name “KPI”, reference
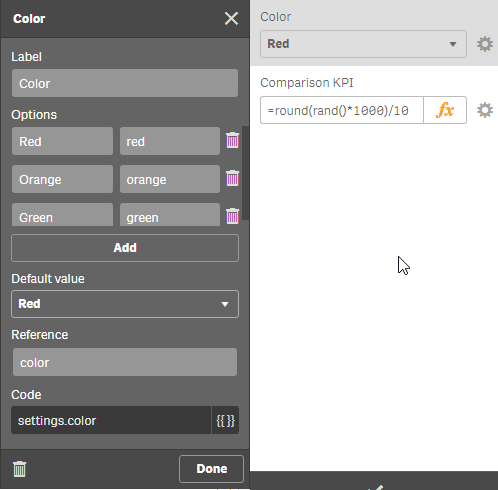
kpi) - Color, containing the values “red”, “green” & “orange” as keys, choose appropriate labels (reference
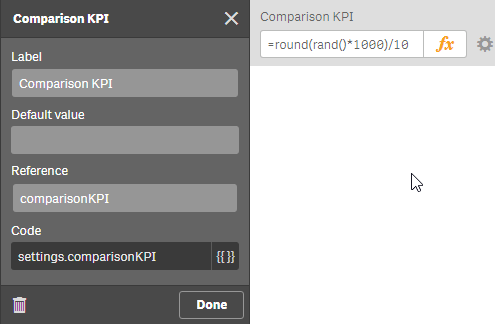
color) - Comparison KPI (Input, reference
comparisionKPI)
- Title (Input, name “Title”, reference
- First extend the existing Widget to make it fully dynamic
- Title, KPI and the color should be bound to the properties defined by the user.
- Test the KPI extensively in an existing app
Don't proceed, first try it, then have a look at the solution ;-)
Solution
First create the properties:
kpiTitle
kpi
color
comparisonKPI
Now let's add bind the HTML output to some of the properties:
<div class="wiSimpleTile">
    <div class="header">{{settings.kpiTitle}}</div>
    <div class="measure">{{settings.kpi}}</div>
    <div class="bar">{{settings.comparisonKPI}}</div>
</div>
So far we have bound all properties, except the color property.
And here comes a nice trick:
- If you have a look at the CSS, you'll find some classes there:
.bar-green.bar-orange.bar-red
- Now let's bind to these classes, depending on the selected color:
...
<div class="bar bar-{{settings.color}}">{{settings.comparisonKPI}}</div>
...
The Final Result
A proposed solution can be review in the widget "Result: Minimalistic KPI" (widget library "widget-exercises").
In this tutorial
On this page