The first example is extremely easy, let’s just create a simple „Hello World“ visualization extension. In the following chapters we’ll improve this example and extend it with additional functionality.
So what’s necessary to create a Qlik Sense Extension? Let’s first have a look at the anatomy of an extension:
The anatomy of a Qlik Sense extension
The following files are mandatory when creating a Qlik Sense Extension:
- Main script file
- Extension meta data file (.qext)
In addition to the mandatory files an extension project may certainly have one or more of the following complementary file-types:
- External scripts
- Style sheets (.css files)
- Images, icons and fonts
- and other resources ...
Skeleton of a script file
This is the basic skeleton of a script file for a visualization extension for Qlik Sense:
define( [ /* dependencies */ ],
    function ( /* returned dependencies as arguments */ ) {
        'use strict';
        return {

            // Paint resp.Rendering logic
            paint: function ( $element, layout ) {
                // Your rendering code goes here ...
            }
        };
    } );
define
define is a concept introduced by RequireJS to define dependencies in your JavaScript files. The idea is to load external dependencies before your main script gets executed (read more here).
In our example above we do not load any dependencies, but we'll do in further chapters of this tutorial.
paint
paint is the main method to render the visualization.
It will be called every time the visualization should be rendered, either because of new data from the server or because it has been re-sized.
The paint method receives two parameters, $element and layout.
| Parameter | Description |
|---|---|
$element | jQuery wrapper containing the HTML element where the visualization should be rendered. |
layout | Data and properties for the visualization. |
Structure of the .qext file
The basic structure of a .qext file looks as follows:
{
    "name" : "Extension Tutorial - Hello World",
    "description" : "Extension Tutorial, Chapter 3, Simple Hello World.",
    "icon" : "extension",
    "type" : "visualization",
    "version": "0.1",
    "preview" : "bar",
    "author": "Stefan Walther"
}
When creating your .qext file you should double-check if this file meets the requirements of a valid .json file.
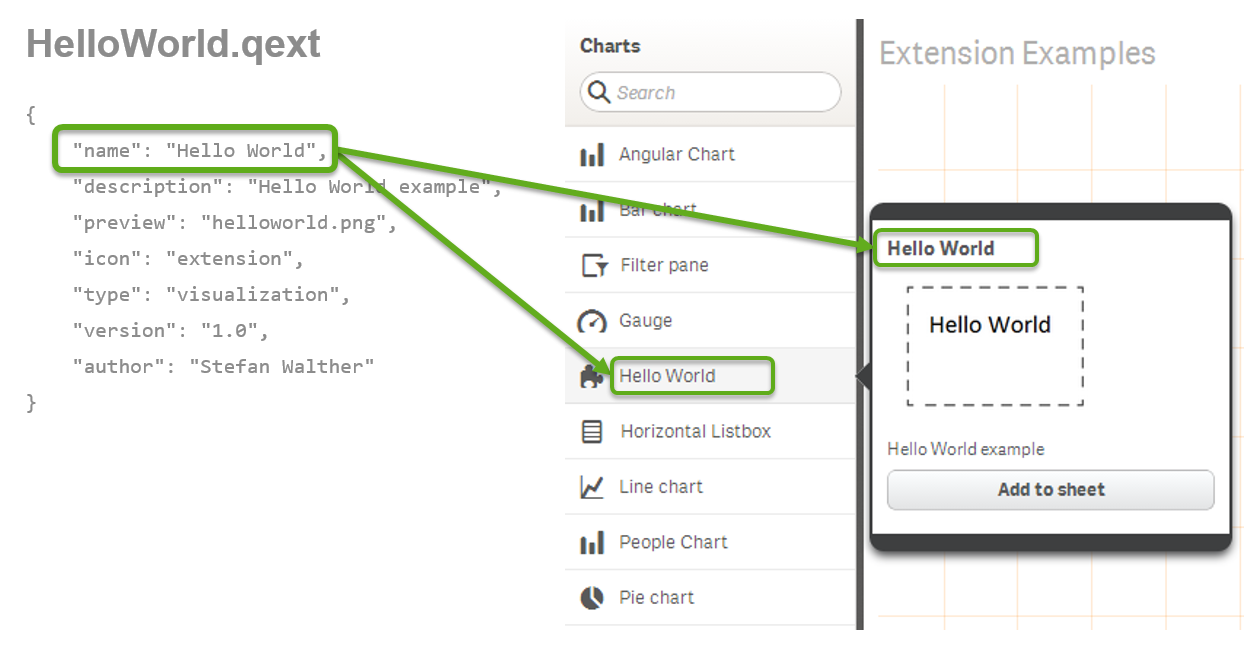
name
The property name will be re-used in the list of visualizations and the preview:
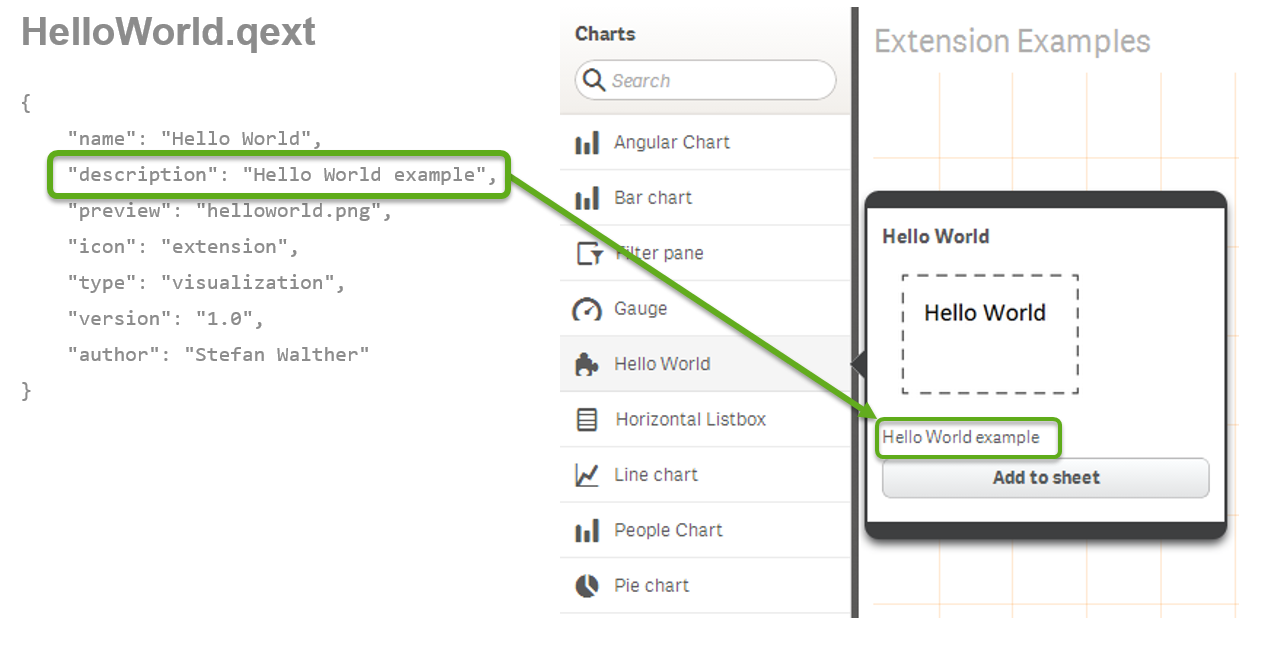
description
The description is visible in the preview:
icon
![]()
The following values are possible for setting the icon:
bar-chart-verticalcombo-chartextensionfilterpanegauge-chartkpiline-chartlistmappie-chartpivot-tablescatter-charttabletext-imagetreemap
You can find more about the icon property in the official documentation.
type
Defines the type of the extension, should be always visualization as of now.
version
Define the version of your visualization extension, I recommend to use Semantic Versioning.
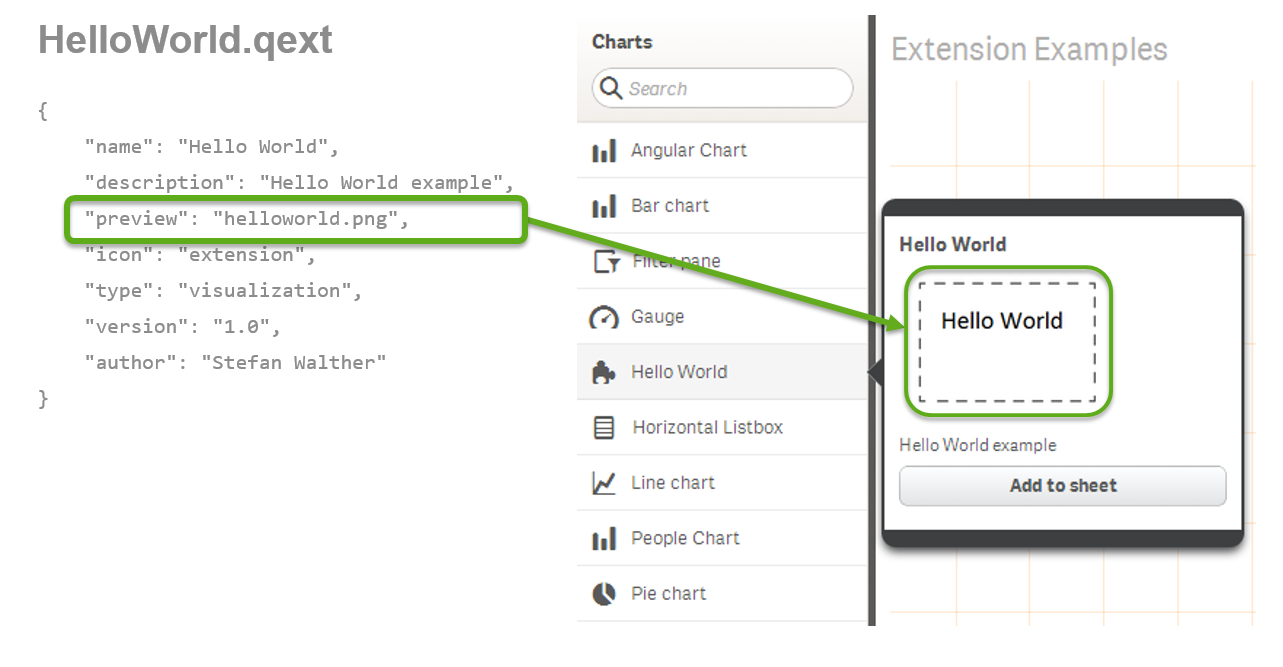
preview
Qlik Sense for Developers states:
You can define a custom preview image that is visible when the visualization has been deployed to Qlik Sense. The preview image is visible when selecting the visualization in the Library or Assets panel. This is done by defining the preview parameter in the qext file.
If you do not define the preview parameter in the qext file, the icon definition will be used for rendering the preview image as well.
If you want to create a preview image, choose width and height of 140px x 123px.
author
author references the author of the visualization extension, so probably your name.
Note, as of this is not visible in neither the Qlik Sense Desktop nor Qlik Sense Server, so you can only get information about the author if you open the .qext file.
Creating the Hello World example
Considering the anatomy of a Qlik Sense Visualization Extension we can now create our "Hello World" example as follows:
Create the Container
The easiest way to get started is to use Qlik Sense Desktop and create a folder containing the two required assets where Qlik Sense Desktop is loading extensions from.
So let's create folder called "Extension Tutorial - Hello World" under
C:\Users\[UserName]\Documents\Qlik\Sense\Extensions\
Create a .qext file
Then create a exttut-03-helloworld.qext file and paste the following code into it:
{
    "name" : "Extension Tutorial - Hello World",
    "description" : "Extension Tutorial, Chapter 3, Simple Hello World.",
    "icon" : "extension",
    "type" : "visualization",
    "version": "0.1",
    "preview" : "bar",
    "author": "Your Name"
}
The Script File
Then add the following script to a file called exttut-03-helloworld.js:
define( [
        'jquery'
    ],
    function ( $ ) {
        'use strict';

        return {

            //Paint resp.Rendering logic
            paint: function ( $element, layout ) {

                var $helloWorld = $( document.createElement( 'div' ) );
                $helloWorld.html( 'Hello World from the extension "01-ExtTut-HelloWorld"<br/>' );
                $element.append( $helloWorld );

            }
        };
    } );
Test It
Before we dig into details what this code does, let's just test it.
Just follow these steps:
- Open Qlik Sense Desktop
- Open an existing app or create a new one
- Open an existing sheet or create a new one
- Go to Edit mode and then you should see the extension "Extension Tutorial - Hello World"
- Drag and Drop it onto the sheet and exit the Edit mode
You should see something like that:
If this is the first time that you are working with Qlik Sense (Desktop) I've added a step by step guide to the appendix which will guide you trough creating your first app and testing this extension.
But wait, something went wrong
Before jumping to the next chapter you'll probably realize that there is something wrong with our solution.
As soon as you resize the (browser-)window you'll recognize that our output get multiplied, so you'll end up into something like that:
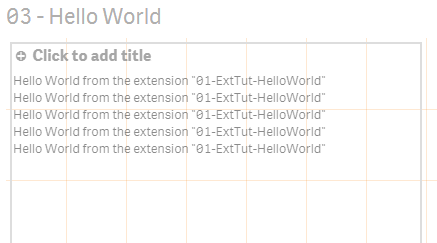
So why did this happen?
The answer is quite easy. Have a look above to the description of the paint. This method will always be called when the visualization should be rendered, and a resize triggers the paint.
So in fact we are appending a new $helloWorld object to $element on every resize.
There are several ways how to solve this, I'll introduce two of them:
1) Be lazy, just remove existing content
You can remove all child nodes of $element at the beginning for your paint method (by using the jQuery empty() method).
Just add the following line at the beginning of paint
$element.empty();
2) Be smarter, detect if the your new node already exists
var id = layout.qInfo.qId + '_helloworld';
var $helloWorld = $( '#' + id );
if ( !$helloWorld.length ) {
    console.log( 'No element found with the given Id, so create the element' );
    $helloWorld = $( document.createElement( 'div' ) );
    $helloWorld.attr( 'id', id );
    $helloWorld.html( 'Hello World' );
    $element.append( $helloWorld );
} else {
    console.log( 'Found an element with the given Id, so just change it' );
    $helloWorld.html( 'Hello World' );
}
Reviewing this example you'll also recognize something new, the usage of the layout object to get the unique Id of the current object (too prevent conflicts if you are using the same object several times on a sheet). We'll talk more about layout in upcoming chapters.
Performance Impact ?
Scared about the performance impact of the first approach? I was too, so I did some basic tests:
http://jsperf.com/emptyorreuse
I leave it to you whether you decide to go with better performance or better readability of your code ...
To improve readability of code examples in this tutorial I'll in general stick to the
empty()pattern.